
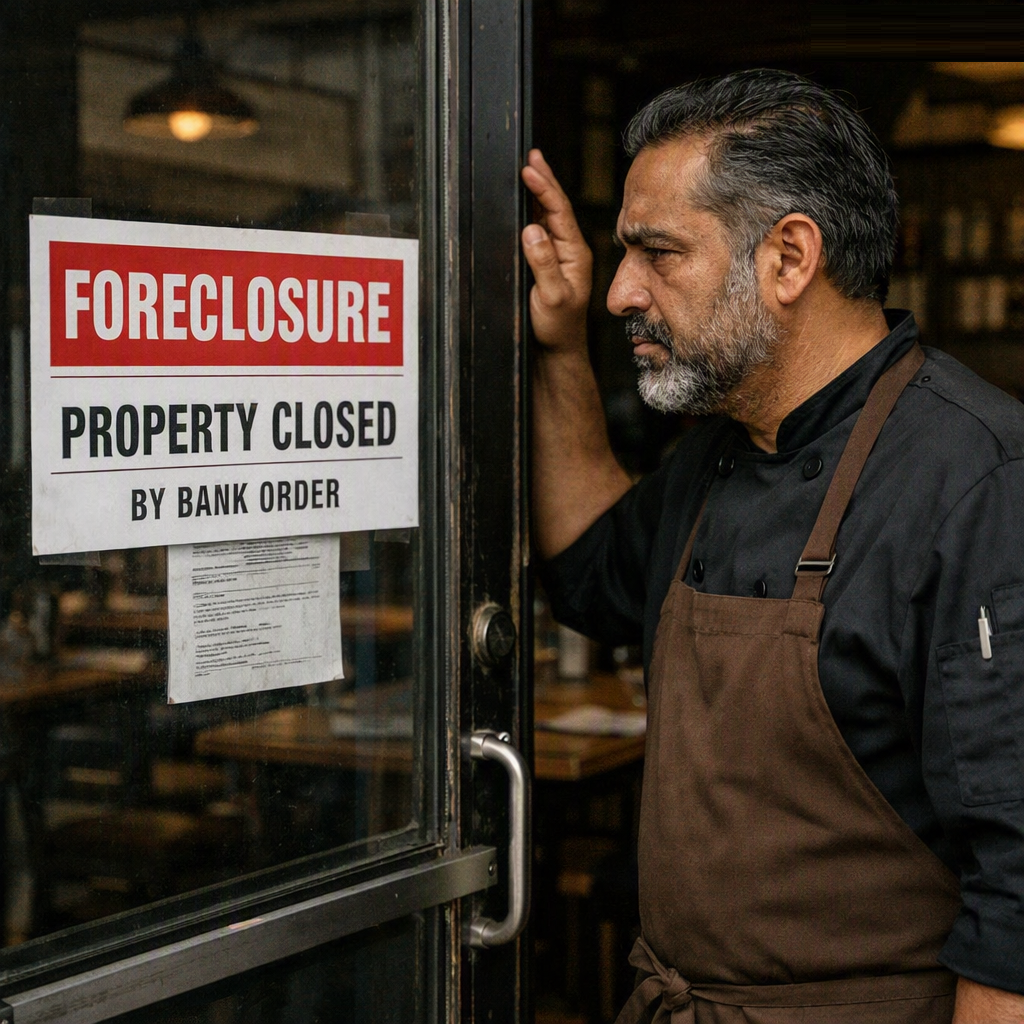
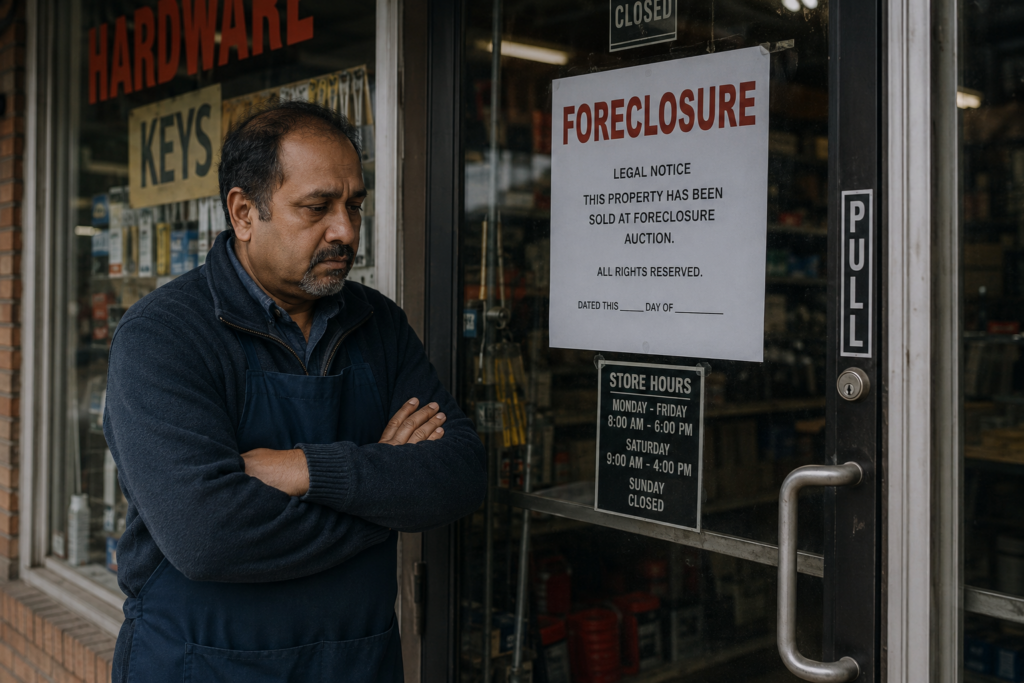
PART 2: COLLAPSE – HOW U.S. BANKS REFUSE LOANS TO NEW ENTREPRENEURS IN LOW-INCOME PLACES BUT GIVE BILLIONS TO CHINA
.
“As we have therefore opportunity, let us do good unto all men, especially unto them who are of the household of faith” (Galatians 6:10).
.
National data from the Federal Financial Institutions Examination Council (FFIEC) and the Federal Deposit Insurance Corporation (FDIC) report that low- and moderate-income (LMI) census tracts (in densely populated low-income areas) annually traditionally receive 22% to 23% of the total count of small business loans.
.
Historically, however, baseline Federal Financial Institutions Examination Council (FFIEC) data shows that low-income census tracts typically capture roughly only 4.1% to 4.5% of the total dollar volume of reported small business loans (Community Reinvestment Act; FFIEC, November 13, 2025).
.
The asset ownership of traditional banks, including commercial and savings banks which actively hold financial assets, are supposed to issue loans and manage customer deposits to new ventures. These FDIC-insured institutions account for roughly over $22 trillion in combined assets, representing a core portion of the financial intermediary sector’s holdings. Banks were invented to strengthen American growth by spurring development through loaning.
.
The FDIC, which is an independent federal agency that maintains stability and public confidence in the financial system by insuring deposits (up to $250,000 per depositor) and managing a Deposit Insurance Fund of roughly $153.9 billion offers the security that could accommodate investiture in new businesses started within places where people need jobs. Secure though they are, they still will not make loans.
.
Regional evaluations (such as by the Woodstock Institute, 2025) demonstrate that businesses in low-to-moderate census tracts receive a disproportionately low share—often under 20%—of traditional small-business bank credit or sub-$100,000 loans relative to their actual density of business population.
.
Low-income census tracts account for roughly 4.5% of all small businesses nationally but are located in highly populated areas. They unfairly receive only about 4.2% to 4.6% of the total number and dollar amount of traditional small business loans.
.
Community and regional banks, moreover, approve small business loans at higher rates than mega-banks, even though specialized institutions such as Community Development Financial Institutions (CDFIs) fill a mild gap by targeting higher percentages of low-income and startup entrepreneurs.
.
Additionally, while Federal Regulations such as the Community Reinvestment Act (CRA) encourage traditional banks to lend in LMI regions, traditional banks often meet these quotas by supporting larger community development projects or partnering with local funds rather than funding unproven individual startups.
.
The FDIC Small Business Lending Survey (2025) notes that banks treat brand-new businesses with prejudicial high caution because of the high risk of failure and lack of financial history. New low-income entrepreneurs must usually admit that they have zero collateral, zero “old wealth,” and zero connections that would encourage banks to lend to them.
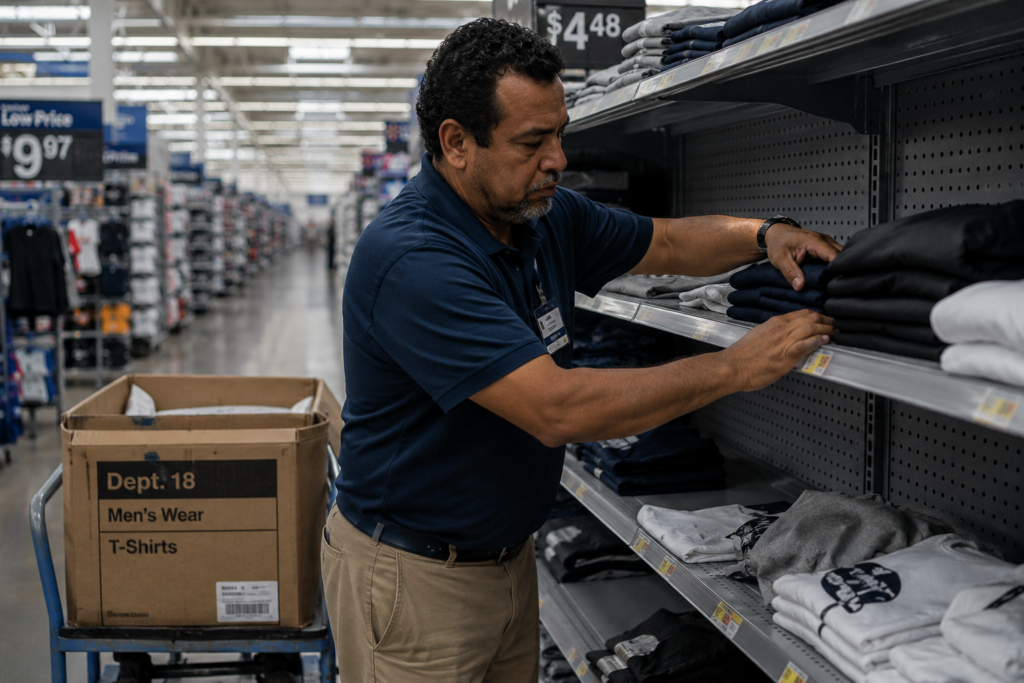
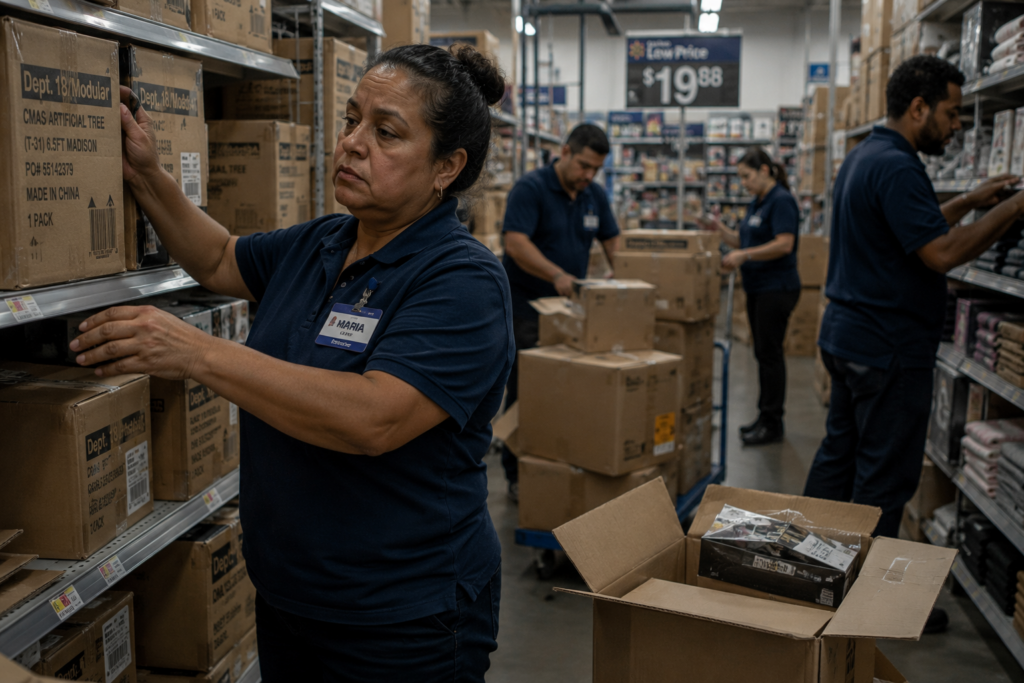
The businesses that do instead get placed in high-population impoverished areas are usually the consumer-type of corporations (McDonalds, CVS, Walmart). These are entities which are enticing to local governments because they fund or subsidize nearby or tangential infrastructural civic improvements such as sidewalks, public lighting, power, and water and also provide a ready tax base that municipalities cannot resist.
.
The demoralizing result of this lending-loan disparity is that no native development happens, along with mass flight of higher-income residents, all in all incurring a destroyed civic identity, mass unemployment, and increased crime.
.
The desperate remnant is underemployed or unemployed but there are nonetheless existing permanent full-time employees, whose status could never be envied. They tend to accept very low wages and badly limited health insurance. Any competition could have come from independent businesses, which if they did exist could have taught workers a trade and offered incentives for their lives to grow.
.
Such sources of hope are eradicated by predatory municipal-corporate growth outfits (e.g., chain and box stores), while wage-slave salaries are spent on buying the goods from these “essential businesses.” This positions a sickening “sustainable” stasis that benefits only the corporations and local governments who are lucratively commissioned to arrange the requisite development contracts.
.
Research confirms that low-wage workers frequently experience job precarity, including unstable schedules, limited access to paid leave or health insurance, and heightened exposure to hazardous physical or environmental work conditions (Economic Policy Institute, July 23, 2024).
.
While millions of people experience “working-poor” status—totaling 6.1 million individuals (in 2023)—the majority of all people living in poverty are actually not employed whatsoever. Most individuals below the official poverty line are children, retirees, or adults outside the labor force due to illness, disability, or caregiving. However, the working-poor rate stood at 3.8% (231,000 people) of all individuals active in the labor force for 27 weeks or more.
.
“What we’re left with today is a warped economy increasingly built on connections instead of competitiveness. Record corporate profits and jaw-dropping gains among elites, but slow growth, stagnant wages and limited opportunities for everyone else. Except, of course, in the Washington, D.C. area, home to six of the ten wealthiest counties in the United States” (“Opportunity, Cronyism, and Conservative Reform”; Senator Mike Lee, Utah, 2014).
.
MEANWHILE: U.S. Financial Support of China Businesses:
.
Data from the Organization for Economic Co-operation and Development (OECD) shows that corporations based in China receive 3 to 8 times more government support from the U.S. relative to firm revenue than their peers in OECD countries.
.
U.S. backing accounts for nearly 60% of Chinese firms’ global market-share gains, compared to 22% globally.
.
The Official Development Assistance (ODA), through its Development Assistance Committee (DAC) accounted for total U.S. aid to China equaling $65 billion in 2024 and $29 billion in 2025 (Development Co-operation Profiles, United States; OECD, June 16, 2026).
.
Meanwhile, the U.S. imported $331.8 billion in goods and services from China but exported $164.2 billion to China during 2025 (USAFacts, July 21, 2026).
.
Subsidy-to-Revenue Statistics are just as infuriating.
.
Overall Disparity: Between 2005 and 2024, Chinese industrial corporations received U.S. state support averaging roughly 2.5% to 3.7% of their annual sales revenue, whereas other world counterparts averaged only 0.4% to 0.7%.
.
Semiconductor Sector: State aid for Chinese chipmakers spiked to nearly 10% of corporate revenue during peak years (such as 2021 and 2022), vastly higher than the global average of roughly 2%.
.
General Prevalence: Over 99% of publicly listed firms in China receive direct, quantifiable government subsidies.
.
Primary Financial Support Structures by the U.S. for China:
.
Below-Market Borrowing: More than half of China’s financial support is funneled through U.S. state-owned and policy banks offering loans well below standard lending benchmarks.
.
Direct Grants and Subsidies: Cash injections from local and central authorities aimed at manufacturing output and factory expansions.
.
Tax Concessions and Input Support: Generous corporate tax breaks alongside artificially cheap provisions for land, electricity, and raw materials like steel and aluminum.
.
Resultant Rise of the U.S. Welfare Families
.
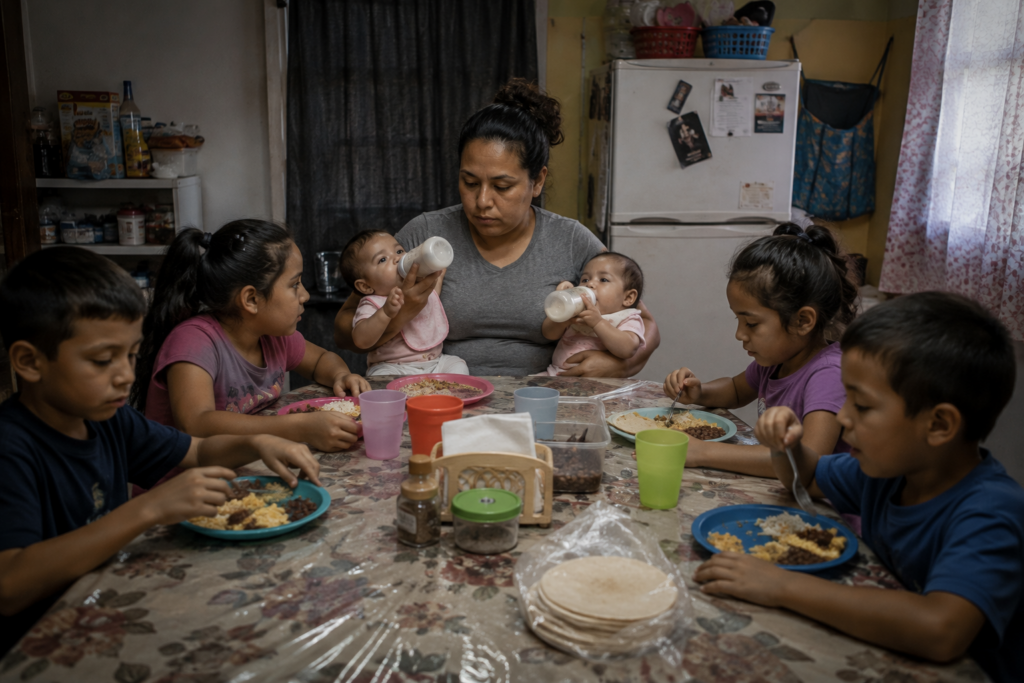
Often, to make ends meet in American neighborhoods, the “institution” of the “Baby Mama” and “Welfare Child” arises. Please click NEXT to see how many poor people exploit their families to stay afloat.
.
Intending that some “version” of “family” may survive, the cult of the dole has predominated poor U.S. regions. It exists as a home usually led by a single mother, be she unmotivated, truly needy, cynical, or sincere, and with no job(s) or partially employed. She may subsist on handouts, but she is meanwhile modeling a culture of cyclical intergenerational dependence upon public coffers to her young. Her children are resultantly alien to self-motivation and for whom neither higher education nor small business loans will ever conceivably be proffered as readily as these resources are by contrast made available to wealthier young adults.
.
The U.S. Census Bureau and the Census Survey of Income and Program Participation (SIPP) track household participation in welfare programs (such as SNAP, TANF, and Medicaid), establishing for our record that single-parent households utilize public assistance at higher rates due to qualifying income thresholds (i.e., their being “dirt poor”).
.
Government agencies and research groups that track non-marital births linked to government-assistance use highlights that in the U.S., about 40% of all annual births are to unmarried mothers, and that Medicaid covers roughly 40% to 42% of all childbirth deliveries (Centers for Disease Control and Prevention, 2024).
.
Research on “multiple-partner fertility” (having children with more than one partner) indicates that roughly 19% of women and 13% of men have children with multiple partners, which is more common in economically disadvantaged groups (Pew Research Center, 2023). Approximately 40% of all babies in the U.S. are born to unmarried mothers (Institute for Family Studies, June 3, 2026).
.
If she does not wish to be a mother, she will often have an abortion to sustain and “enjoy” her cyclical intergenerational poverty better. Please see PART THREE – concerning this Social Collapse, by clicking NEXT.